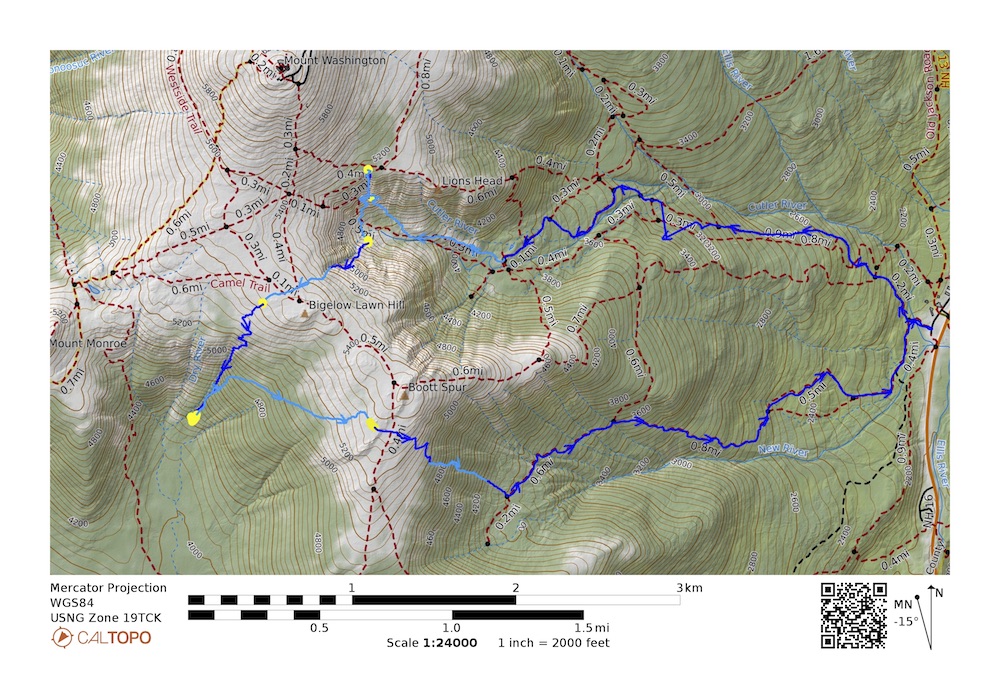
I was going through some old tracks and found a track from a trip I did in March 2019. This is a pretty classic tour for me to do. The day I did this tour the avalanche hazard was low. You can see the archived forecast for the day here. The day ended up warmer than forecasted with temperatures getting above freezing at the altitude of the ravines, you can get that info from the next days forecast here.
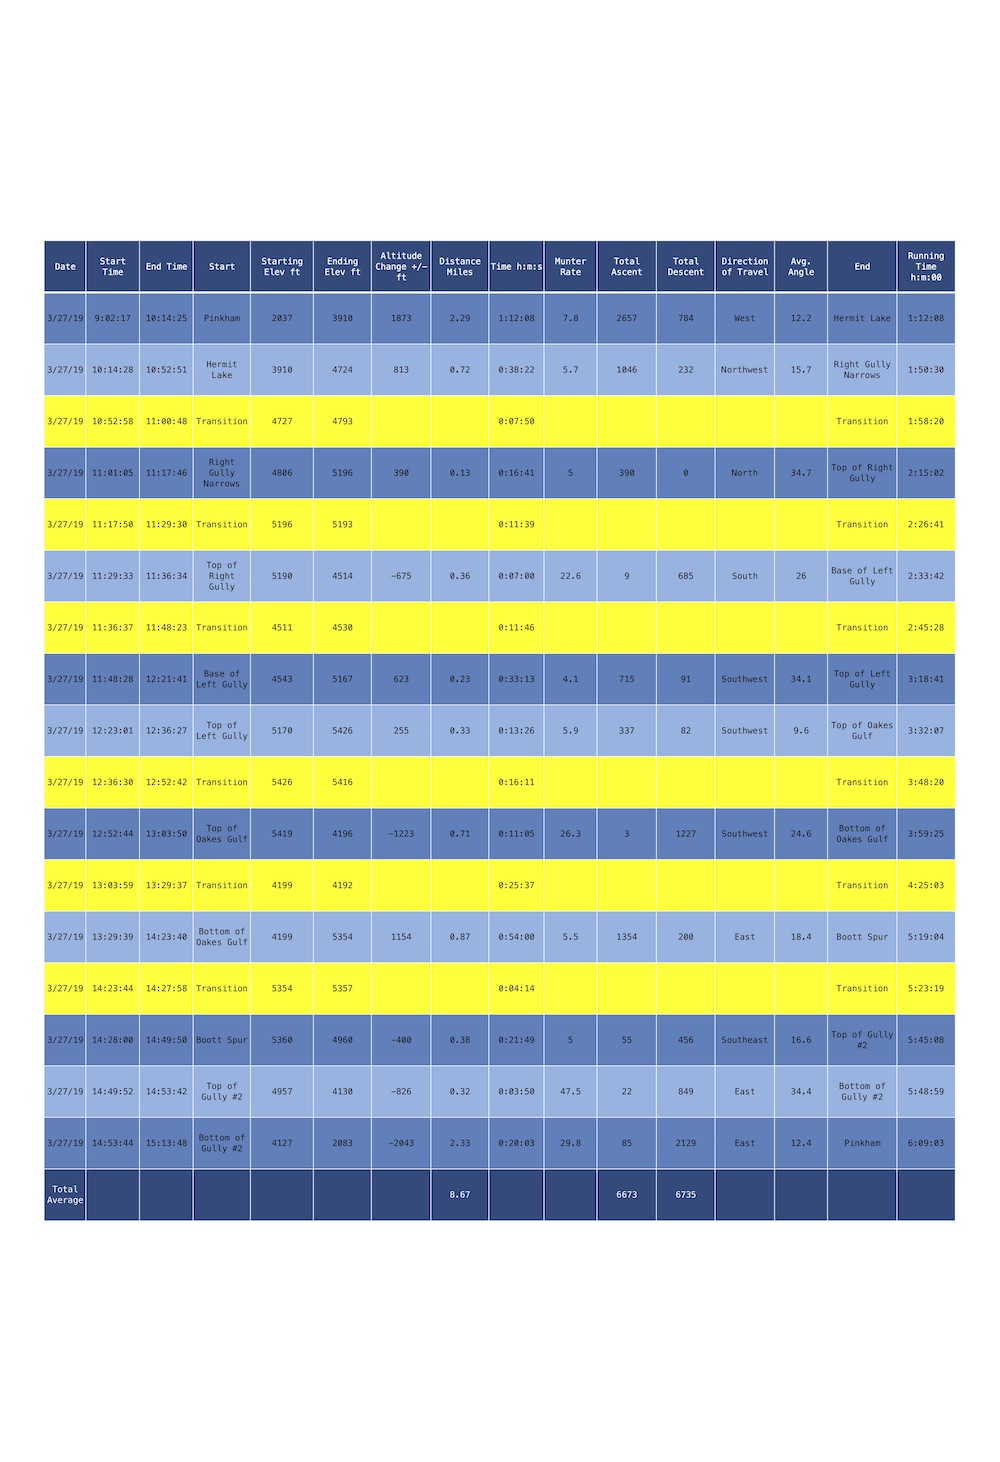
Because of the program I developed I was able to reverse engineer the route plan with the actual times and other data. On this tour I wasn’t going for a record time, it was just a good solid pace with a few breaks as you’ll see in the data. I say this so you can calibrate the information for your pace and adjust as you see fit, either planning a faster or slower pace.
The map and the data are color coded so that you can visualize each leg. The yellow areas are the transitions. Below you will find the GPS track as a .gpx file and .kml, the data as a .csv. For the map and a PDF of the data just click the photos or there are also links below.
3-27-19 GeoPDF Map
3-27-19 Data
3-27-19 csv
3-27-19 kml
3-27-19 gpx (Some browsers add a .xml extension, delete the .xml leaving only the .gpx extension before saving)


